imixs-cloud
The Prometheus Operator
The Prometheus Operator project provides Kubernetes native deployment and management of Prometheus and related monitoring components. The purpose of the project is to simplify and automate the configuration of a Prometheus based monitoring stack for Kubernetes clusters.
Kube Prometheus
Based on Prometheus Operator the project kube-prometheus provides example configurations for a complete cluster monitoring stack. The goal of kube prometheus is to simplify the deployment and configuration of Prometheus, Alertmanager, and related monitoring components. The Imixs-Cloud monitoring is based on the latest version of the kube-prometheus so no additional configuration is need here.
The internal address for data access the prometheus service is:
http://prometheus-k8s.monitoring.svc:9090
Grafana
The Grafana service is the front-end application used to visualize the data collected by Prometheus. The grafana service provides a web interface with rich functionality for monitoring and alerting.
To access grafana you need ot setup a Ingress route. See the Deployment Guide for details.
Deployment
kube prometheus is intended to be used as a library. So all you need to do is to checkout the project form github on your master-node.
# Checkout the project form Github
$ cd
$ git clone https://github.com/prometheus-operator/kube-prometheus.git
$ cd kube-prometheus
# Create the namespace and CRDs, and then wait for them to be availble before creating the remaining resources
$ kubectl create -f manifests/setup
$ until kubectl get servicemonitors --all-namespaces ; do date; sleep 1; echo ""; done
$ kubectl create -f manifests/
kubectl create -f manifests/setup until kubectl get servicemonitors –all-namespaces ; do date; sleep 1; echo “”; done kubectl create -f manifests/
First Login
For the first login use the userid ‘admin’ and the password ‘admin’. You will be force to change the admin password first.

Setup the Prometheus Database
The prometheus database is automatically configured by kube prometheus. You can verify the configuraiton on the grafana configuration page:
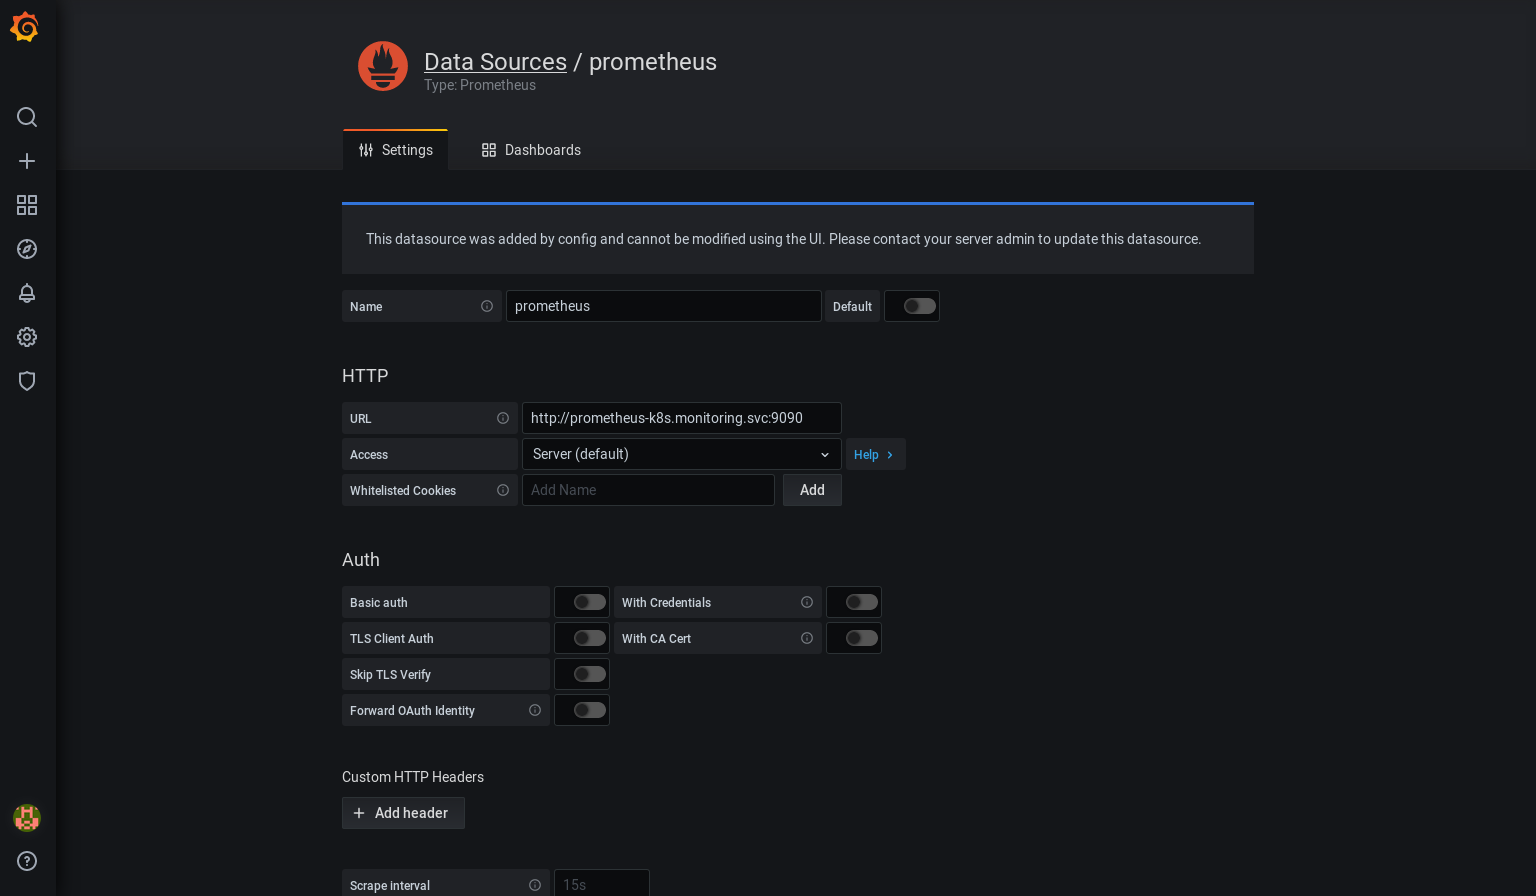
You don’t need to add or change additional data.
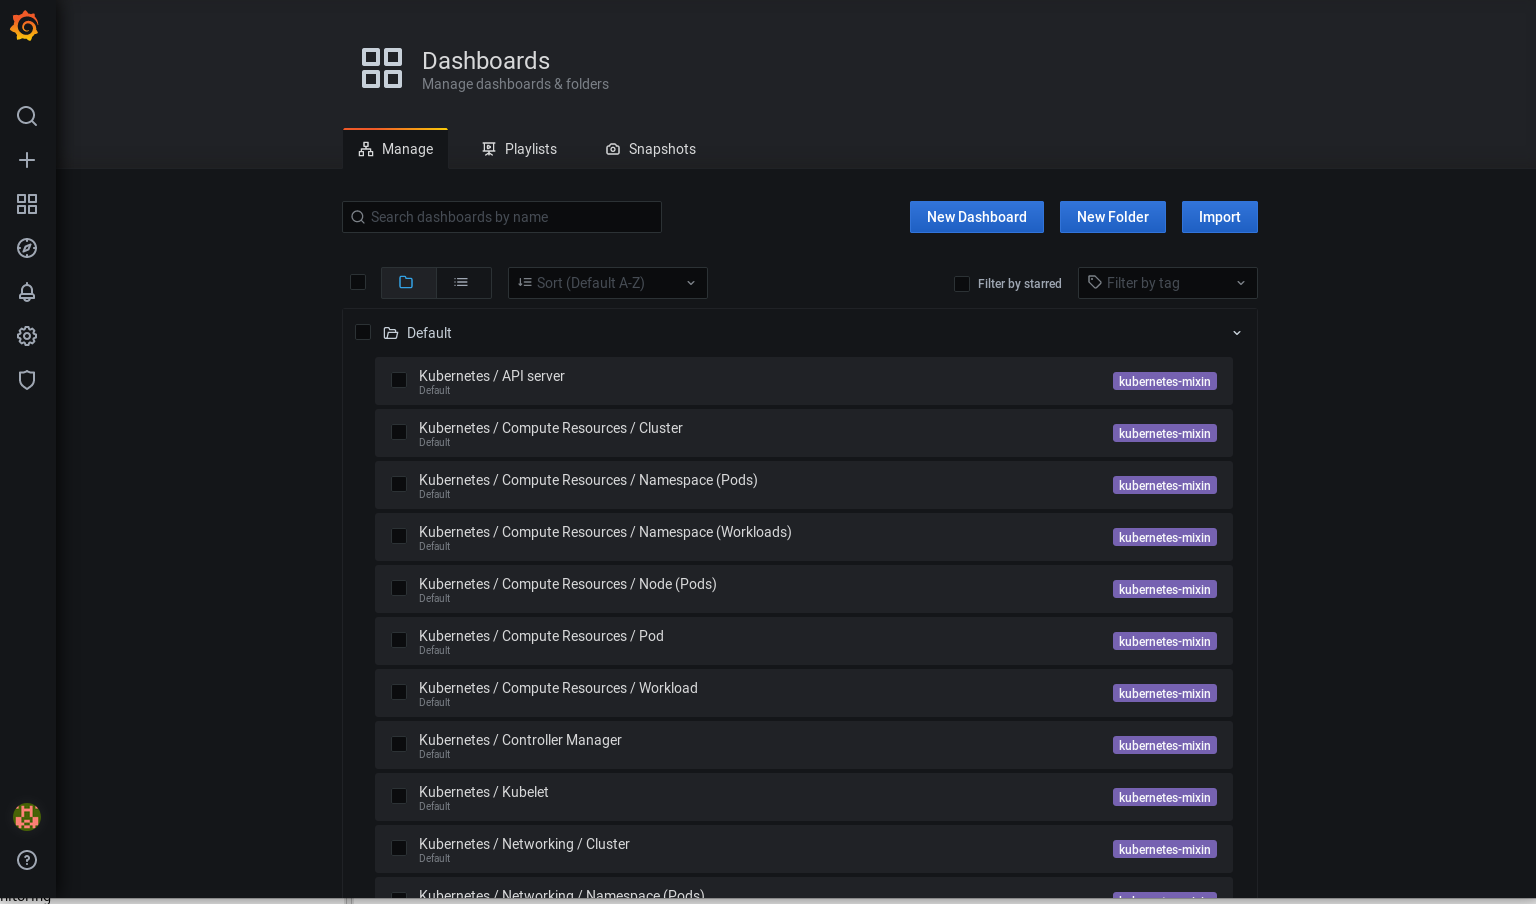
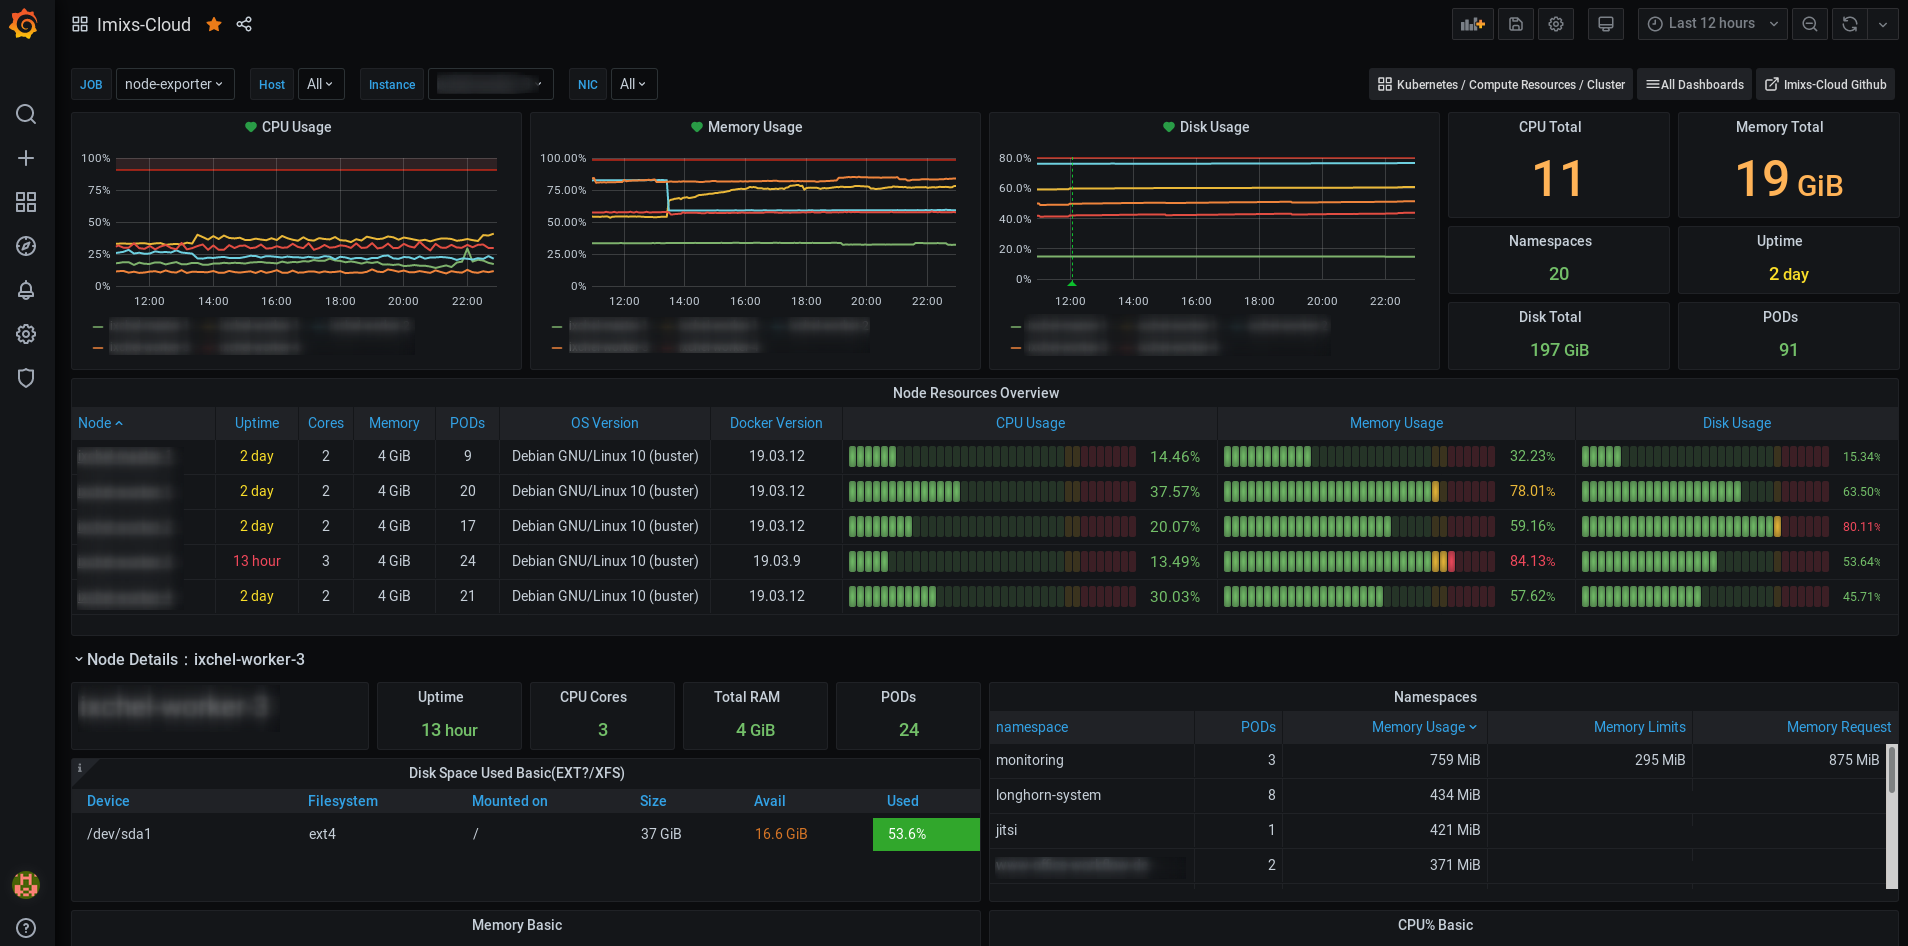
The Dashboards
The kube prometheus project provide a large number of Grafana dashboards which can be access from the dashboard configuration page. You can access the dashboard from the dashbard management plane:
You can also import additional Dashboards as JSON or by a Dashboard id:
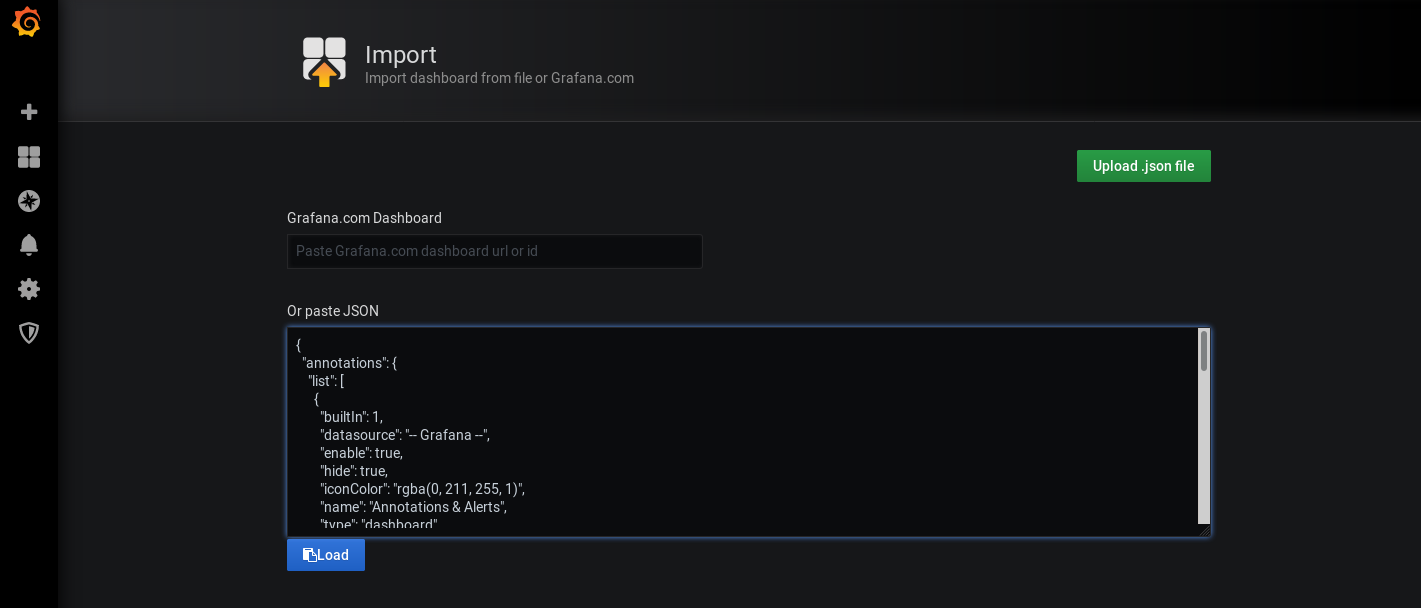
Here is a list of usefull dashboards which can be used in Imixs-Cloud monitoring:
- https://grafana.com/grafana/dashboards/12919
- https://grafana.com/grafana/dashboards/11074
- https://grafana.com/grafana/dashboards/8171
Kustomization
After you have setup kube prometheus you can also customize it using the kubectl tool Kustomize.
For that first create a “kustomization.yaml” file like this one:
namespace: monitoring

bases:
- ../../../kube-prometheus
#- https://github.com/prometheus-operator/kube-prometheus

resources:
- imixs-cloud-ingress.yaml

patchesStrategicMerge:
- grafana-env.yaml
In this file a new ingres.yaml resource was define and a grafana-env.yaml file to add some custom environment variables to the grafana service:
Grafana SMTP configuration
With the following grafana-env.yaml you can setup you smtp config used within grafana:
grafana-env.yaml:
apiVersion: apps/v1
kind: Deployment
metadata:
  name: grafana
  namespace: monitoring
spec:
  template:
    spec:
      containers:
      - name: grafana
        env:
          - name: GF_SMTP_ENABLED
            value: "true"
          - name: GF_SMTP_HOST
            value: "my-mailgateway.kube-system:25"
          - name: GF_SMTP_FROM_ADDRESS
            value: "info@foo.com"
To apply the new grafana configuration apply the kustomization configuration and run:
$ kubectl apply --kustomize ../monitoring/
Ingress
To access the grafana dashboard from your Internet domain you can use the traefik reverse proxy configured in Imixs-Cloud. Just edit the file imixs-cloud-ingress.yaml and replace [YOUR-DNS-NAME] whit the name of you monitoring Internet domain name.
To apply the ingress configuration aplly the kustomization configuration explained above and run:
$ kubectl apply --kustomize ../monitoring/
Uninstall
To teardown the stack run:
$ kubectl delete --ignore-not-found=true -f manifests/ -f manifests/setup