imixs-cloud
Monitoring
The Core metrics collected by the metrics-server are stored in memory. To collect and monitor the core metrics over time an additional mechanism for aggregating this data is needed. As all the Kubernetes internal metrics is exposed using the Prometheus exposition format, a Prometheus service can be used to aggregate metrics not only from the metric-server but also from other components as also from individual business applications.
The imixs-prometheus stack is a deployment stack including all necessary services to monitor a kuberentes cluster. This part is independent from the Imixs-Cloud project and can also be applied to other kubernetes setups. The imixs-prometheus stack is based on kustomize which allows you to get better insights how the stack is build and also a convenient way for customizing the stack for individual needs.
The following section shows how to setup a Monitoring with Prometheus and Grafana.
The Components
imixs-prometheus consists of the following services:
Prometheus
Prometheus is the open-source systems monitoring and alerting toolkit. The Prometheus service is the database used for collecting the metric data. The Prometheus server is typically only used internal to grab data from the metric api and not accessible from outside of your cluster. The internal address for data access is:
http://prometheus:9090
Grafana
The Grafana service is the front-end application used to visualize the data collected by Prometheus. The grafana service provides a web interface with rich functionality for monitoring and alerting.
kube-state-metrics
The kube-state-metrics is a simple service that listens to the Kubernetes API server and generates metrics about the state of the objects. It is not focused on the health of the individual Kubernetes components, but rather on the health of the various objects inside, such as deployments, nodes and pods. The kube-state-metrics allows to access these metrics from monitoring systems such as Prometheus.
node-exporter
The Prometheus node-exporter is an exporter service for hardware and OS metrics exposed by *NIX kernels, written in Go with pluggable metric collectors.
The Installation
imixs-prometheus is based on kustomize which allows you easy deployment and allows to change every detail of the configuration in an easy way.
The Prometheus Configuration
The configuration details how prometheus scrapes the metric data form the different metric APIs is defined in the config file config/prometheus.yaml. You can use this file to customizes the different jobs or add new jobs for you own business applications.
The configuration is provided as a config map which need to be generated before you can start the deployment. To create the config map run:
$ kubectl create namespace monitoring
$ kubectl create configmap prometheus-config --from-file=./management/monitoring/imixs-prometheus/config/prometheus.yml -n monitoring
Deployment
A basic deployment can be run via kubectl and the base kustomize setup hosted on github:
$ kubectl apply -k https://github.com/imixs/imixs-cloud/management/monitoring/imixs-prometheus/base
If you have already cloned this repo you can also use your local manifest files:
$ kubectl apply -k management/monitoring/imixs-prometheus/
Undeploy the Monitoring stack
To undeploy the monitoring stack run:
$ kubectl delete -f management/monitoring/metrics-server/
$ kubectl delete configmap prometheus-config -n monitoring
$ kubectl delete namespace monitoring
First Login
For the first login use the userid ‘admin’ and the password ‘admin’. You will be force to change the admin password first.

Setup the Prometheus Database
The Prometheus database is automatically configured by imixs-prometheus. You can verify the configuration on the Grafana configuration page:
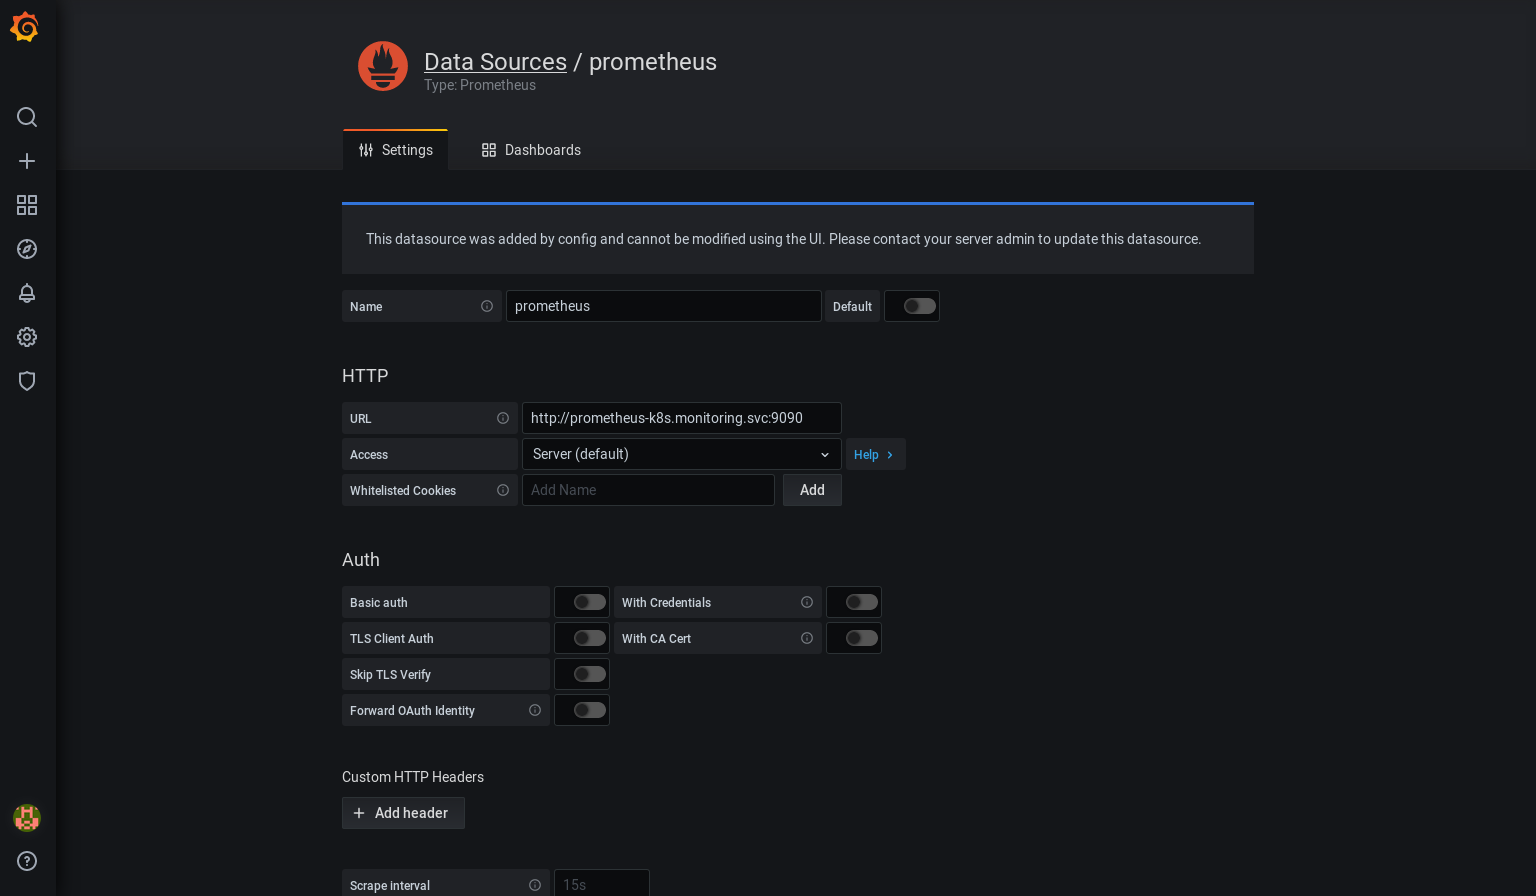
You don’t need to add or change additional data.
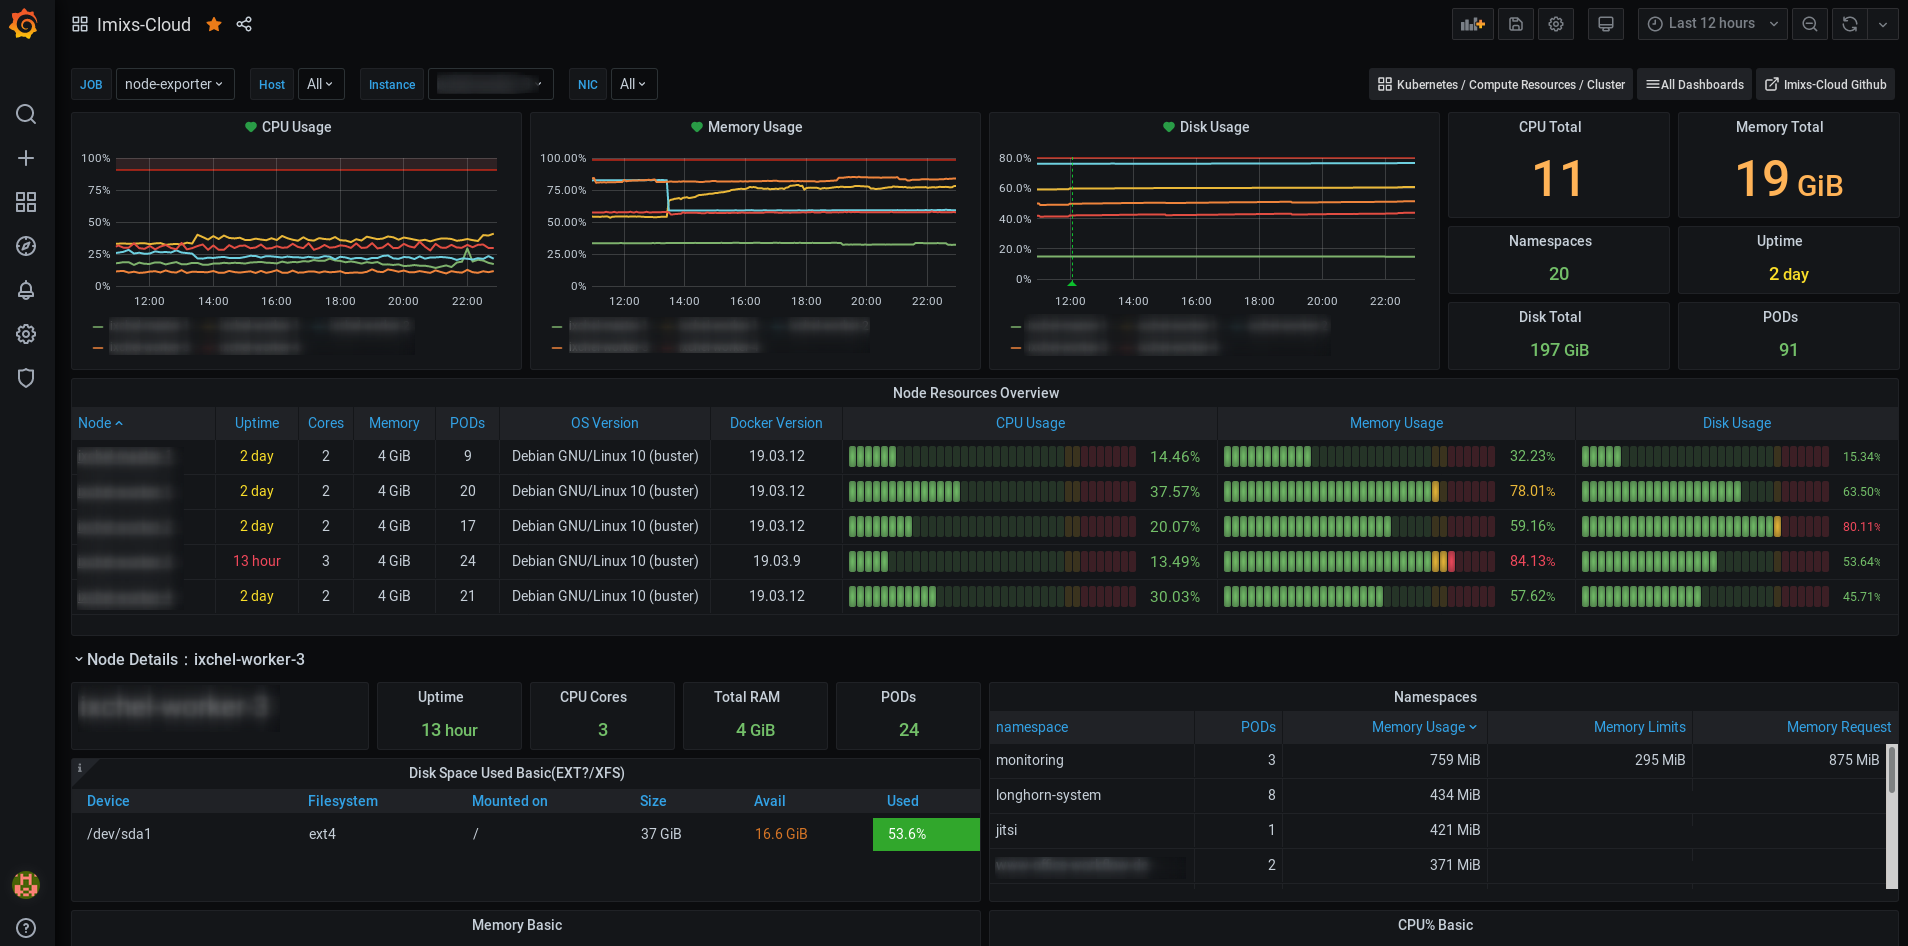
The Dashboards
The imixs prometheus project provides already a Grafana dashboard which can be imported from the dashbard management plane:
You can import the Dashboard simply by the Dashboard id 12919 or by importing the dashboard json file located under /dashboards/imixs-cloud.json.
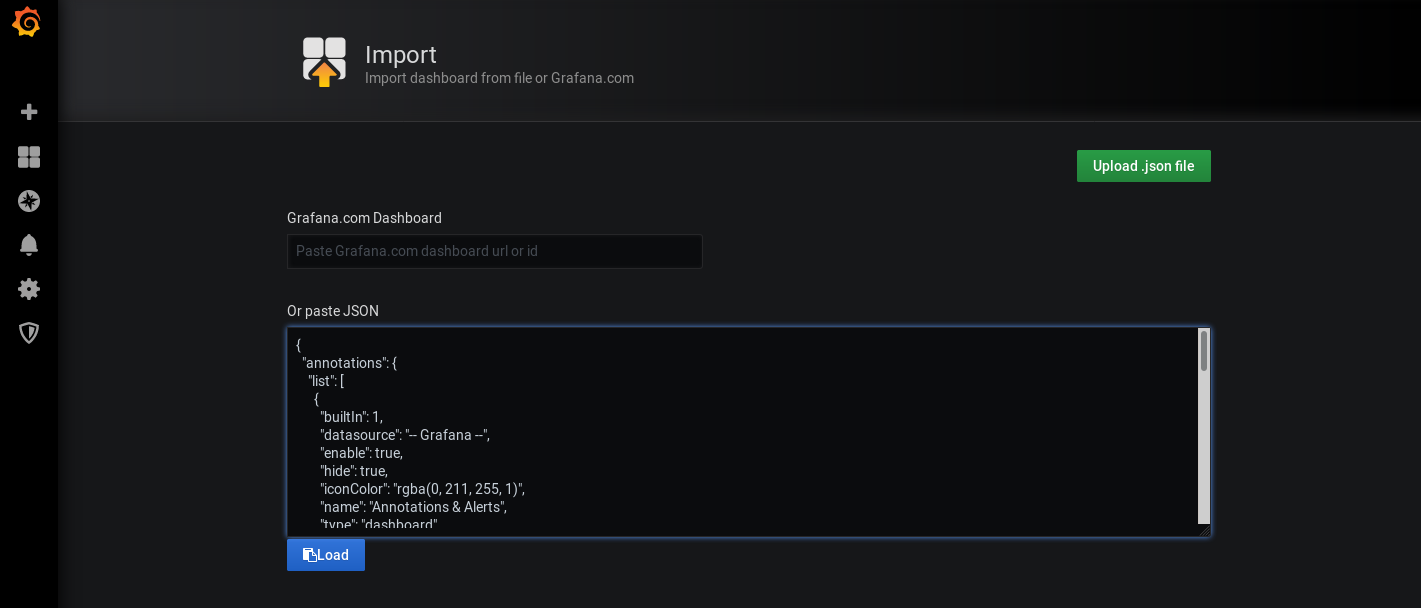
You can add the dashboard to your profile.
Customizing Imixs-Prometheus
As the Imixs-Cloud monitoring stack is based on kustomize you can easily apply additional resources or apply configuration patches in your own kustomize.yaml file.
The following example shows how to apply custom patches and resources in a kustomize.yaml file:
namespace: monitoring

bases:
- https://github.com/imixs/imixs-cloud/management/monitoring/imixs-prometheus/base
#- ../base/

resources:
- 050-persistencevolume.yaml
- 060-ingress.yaml

patchesStrategicMerge:
- 010-patch-volumes.yaml
- 030-patch-grafana-env.yaml
To apply a custom deployment run:
$ kubectl apply -k management/monitoring/imixs-prometheus
In the following section some of the custom configuration patches are explained:
Ingress Configuration
Prometheus and Grafana can both be configured with an additional ingress network so you can access the Dashboards form your public Internet address. The file 060-ingress.yaml shows an example setup where you need to replace [YOUR-INTERNET-NAME] with an valid Internet domain name.
# Grafana Ingeres Config
---
kind: Ingress
apiVersion: networking.k8s.io/v1beta1
metadata:
  name: grafana-tls
  namespace: monitoring
spec:
  rules:
  - host: [YOUR-INTERNET-NAME]
    http:
      paths:
      - path: /
        backend:
          serviceName: grafana
          servicePort: 3000
Create a Storage Volumes
Monitoring your cluster over a long period of time the stack needs some durable storage volumes to persist prometeus-data and grafana configuration. Otherwise the collected information is lost when you redeploy your monitoring stack the next time.
To persist the data in a storage volume you can provide longhorn data volumes to be used by the Imixs-Cloud monitoring stack.
First create the following new Storage volumes:
monitoring-grafana-data   1G
monitoring-prometheus-data   10G
To add the new volume configuration just add a patchesStrategicMerge and resoruces into your own kustomize.yml file. You can find an example in the files
- 050-persistencevolume.yaml
- 010-patch-volumes.yaml
Grafana Configuration
To apply additional configurations to grafana you can provide most of the configuration settings via environment variables. With kustomize you can easily apply additional parameters for example to set an email server config. An example is included in the file 030-patch-grafana-env.yaml
---
###################################################
# Grafana SMTP Config
###################################################
apiVersion: apps/v1
kind: Deployment
metadata:
  name: grafana
  namespace: monitoring
spec:
  template:
    spec:
      containers:
      - name: grafana
        env:
          - name: GF_SMTP_ENABLED
            value: "true"
          - name: GF_SMTP_HOST
            value: "my-mailgateway.kube-system:25"
          - name: GF_SMTP_FROM_ADDRESS
            value: "info@foo.com"