imixs-cloud
Imixs-Cloud - Ceph Monitoring
When you followed the Quick install guide for ceph you have protected your ceph cluster from unauthorized access with a firewall.
To enable the Ceph Monitoring capabilities in the Web Dashboard, you can install a Reverse Proxy using a nginx container with basic authentication within your Imixs-Cloud.
You can find a nginx deployment for kuberenets at ./management/ceph/monitoring/010-nginx.yml. Edit this file and replace .foo.com with the FQDN of your ceph cluster node.
Via this Kubernetes Nginx configuration, you will have a reverse proxy that allows a secure access into your public ceph cluster node.
https://grafana.ceph.coo.com
Deployment of the Reverse Proxies
For deployment of the nginx reverse proxy first create a secet for the Grafana Ingress:
$ kubectl create secret generic ceph-basic-auth -n ceph-monitoring --from-file=management/registry/keys/auth
Next deploy the reverse proxy
$ kubectl apply -f management/ceph/monitoring/
After your reverse proxy for grafana is up and running you need to tell your ceph cluster the new Grafana Frontend URL so that grafana boards can be displayed within the Web Dashboard. On the ceph manger node run the following ceph command:
$ sudo ceph dashboard set-grafana-frontend-api-url https://grafana.ceph.foo.com/
Replace grafana.ceph.foo.com with your corresponding FQDN name
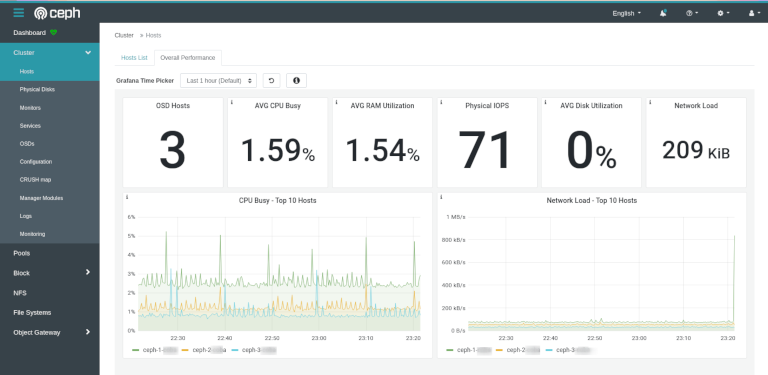
Now you can access the grafana monitoring from the ceph web dashboard. With the deplyoed secret the Grafana Web UI is protected with a basic authentication: